Let’s imagine you’re in charge of your company’s Customer Evidence Program, and the end of tax year is looming. As usual, your boss asks “How did your program perform this year?” as a prelude to next year’s budget planning. Now, do you have meaningful info to answer that question?
If you’re already running a CE Program, I’ll give you 10 seconds to respond. If you have a great answer please put it on the comments, otherwise I hope this article will spare you some headaches.
If you’re not running a program yet, please read on, you won’t regret it. And by the way, have you already contacted Melis Hamurculu, our CE expert for a free consultation?
All that glitters is not gold
If you’ve hurriedly done a search, you’ll probably have found a ton of answers for “program performance measurements” and the like. But be warned, all that glitters is not gold.
Performance measures or Key Performance Indicators (KPIs) vary from one company to another, and depend on your company’s goals and priorities. This means there is no perfect formula.
Meanwhile, it’s not only a question of tailoring your measurement plan to your company, it’s also a question of creating a plan that is dynamic. One that should be “growth-driven” and easy to adjust, on a case by case basis, to act on feedback from your stakeholders.
There is a worldwide trend to measure every single project in terms of Return on Investment (ROI). I won’t say it’s bad, on the contrary it’s an important KPI, but there is a lot more to do from a measurement perspective. Simply tracking ROI could blind you from other important insights. For example, you might have an amazing ROI, but if you’re not paying attention to the health of your lead pipeline, you could be in serious trouble next year.
Some of my favourites
As I said, KPIs vary from company to company, and setting the best ones requires a deep dive into your company’s priorities and processes. But here are some I’d like to share to give you food for thought and a head start:
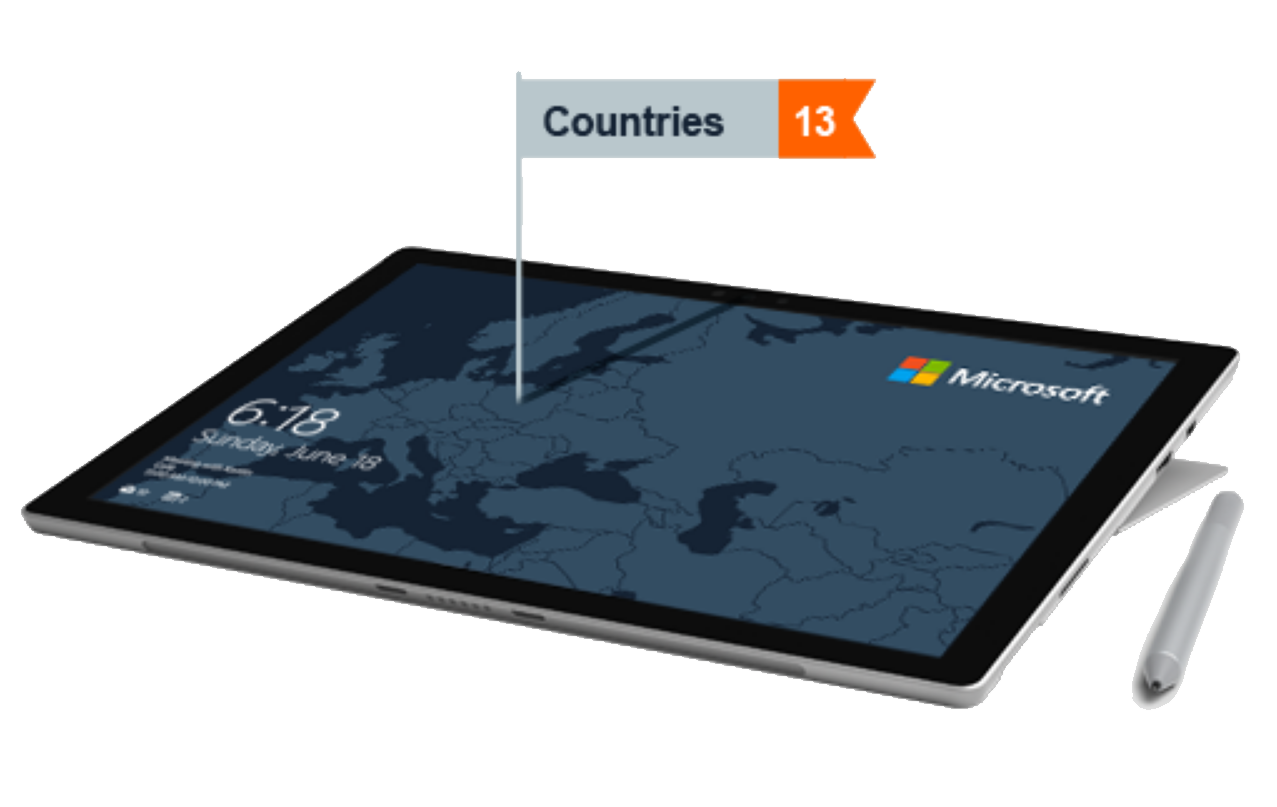
- Increase in Program Usage. An early stage program will likely be used mostly by marketers, but as it evolves users will increase to include e.g. sales, HR and other departments. Tracking who is accessing your assets and database is a great indicator of your program’s growth and impact.
- Influenced Revenue. Top-level managers will be impressed with the number of sales conversations your program generates. There are many tools you can use for this which will depend on your CRM, its features and the integrations it allows.
- Leads funnel. Tracking how many reference nominations are in the queue can give you a healthy check of the program growth and whether you’re likely to hit your goals. You can also learn from the leads funnel how many of those nominations were converted to legit references in the program, to get a sense of the quality of the nominations you are getting.
- Amount of published cases. Don't forget the basics. Even if this one seems obvious, it’s an important one for your stakeholders. You probably have a quota of cases to publish every month, so this KPI must always be there to track how many cases have been finished.
- Amount of Downloads. This last one depends on the formats you use at the time of publishing. For one of our most important clients we create a corporate slide for each case which is attached to the written or video case study. Tracking the number of downloads help us to gauge the reader’s level of interest in wanting to learn more about the case.
Besides making decisions about which KPIs to use, you must also consider segmentation, which also depend on your company structure and priorities, but is typically done in terms of:
-
Industry
-
Segment
-
Vertical
-
Region
-
Product
Showcasing, last but not least
For every project you need to put yourself in your customer’s shoes. And I’m 99% sure that your customer will run away from the word “analytics”. It’s therefore up to you to showcase your data in a friendly way. This part is as important as choosing your KPIs. You can’t risk putting customers off with dry data that is badly presented in terms of design, colour or font sizes.
Together with this comes storytelling - which is at the heart of Wings4U. You have to TELL A STORY when you showcase your performance measures. The numbers are not the main characters here, the data insights are. It’s your job to interpret the numbers and draw insights to build into a story that is aligned to your company’s priorities and challenges.
Meanwhile, for the technical part, there are many tools out there to help you create cool dashboards and share them online. My favorite is Microsoft Power BI. It’s simple and also has a long list resources to help you make the most of it. You can even present your dashboard on a PowerPoint/ GSlide format. With all of this, the key is to tell a story and to open your table or dashboard to discuss the best plan of action, based on the insights you’ve drawn from your data. Meanwhile, asking for quotes can be a great first step to implementing a customer evidence strategy with your happy customers. It can open up further discussions about the how customer evidence assets can benefit both parties in so many great ways.
Remember, when it comes to showcasing impact and value, no one can say it better than a happy customer!
Key takeaways
-
A measurement plan delivers meaningful information about the the status and results of your program, a powerful tool especially at budget planning time.
-
Don’t rely on magic formulas or templates, measurements or KPIs must be aligned to your company goals and priorities.
-
Whilst the KPIs you choose are important, it’s also about segmentation. Define your segments and ensure you can “split” KPIs into the segments as necessary.
-
The way you showcase your data is super important, especially because your stakeholders probably don't have an analytical mindset,so invest time and resources to make it user friendly.
- When showcasing remember to tell a story with your data, one that is compelling for your stakeholders and helps them fully understand the reasons and implications of what you’re presenting to them.
Conclusion
This is just one of series of articles I would love to write about measuring programs, to introduce the topic and open up the discussion.
Of course, you will have own experience, opinions or maybe some doubts. That’s why we have the comments section here below. So, let’s start a conversation right now. I’d love to hear your thoughts.
You can also connect with me on LinkedIn to chat further, it would make my day!