Are you tired of presenting numbers to stakeholders who just don't seem to get what any of it means? Maybe it's time to up your storytelling game. In this article, Iulia shares tips on how to create engaging, impactful reports that clearly communicate the value of your customer advocacy program. From empathizing with your audience to providing context and action plans, Iulia covers the key elements of a successful report that tells a story. So, whether you use a sophisticated reporting tool or a simple spreadsheet, you can showcase the impact of your advocacy program and inspire others to join in. Ready to take your reporting to the next level? Read on to learn more.
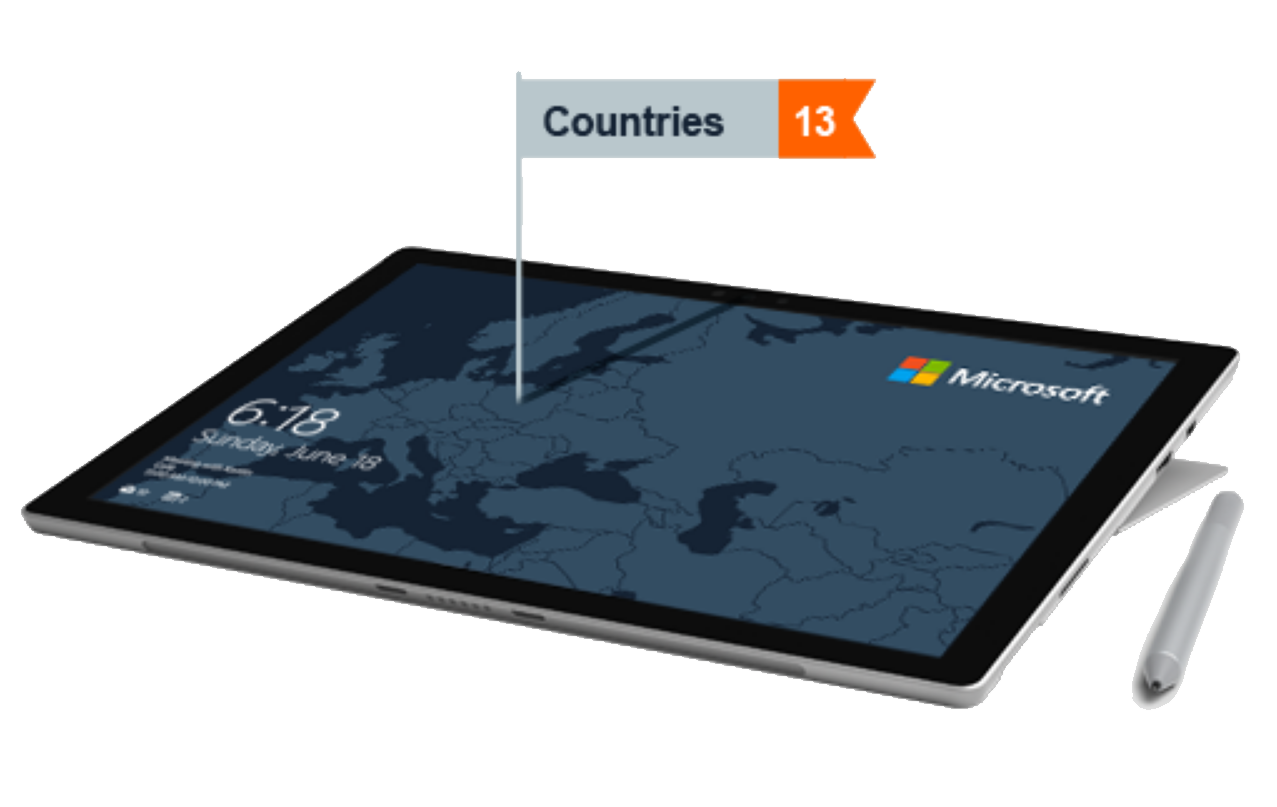
There is no doubt that gathering data is more accessible than ever. Advocacy Managers continuously refine reporting and leverage it to scale their programs. We went from tracking a handful of data points, such as new advocates onboarded, reference requests fulfilled, and stories published, to looking at every step of the process and the response we get.
But what are those dashboards doing for the teams you work with? For your stakeholders or anybody that is not directly involved in the activities and projects within your Customer Advocacy program?
To gain the trust and collaboration of other teams, all while demonstrating the value of Advocacy, you need to tackle another type of reporting: the storytelling of numbers.
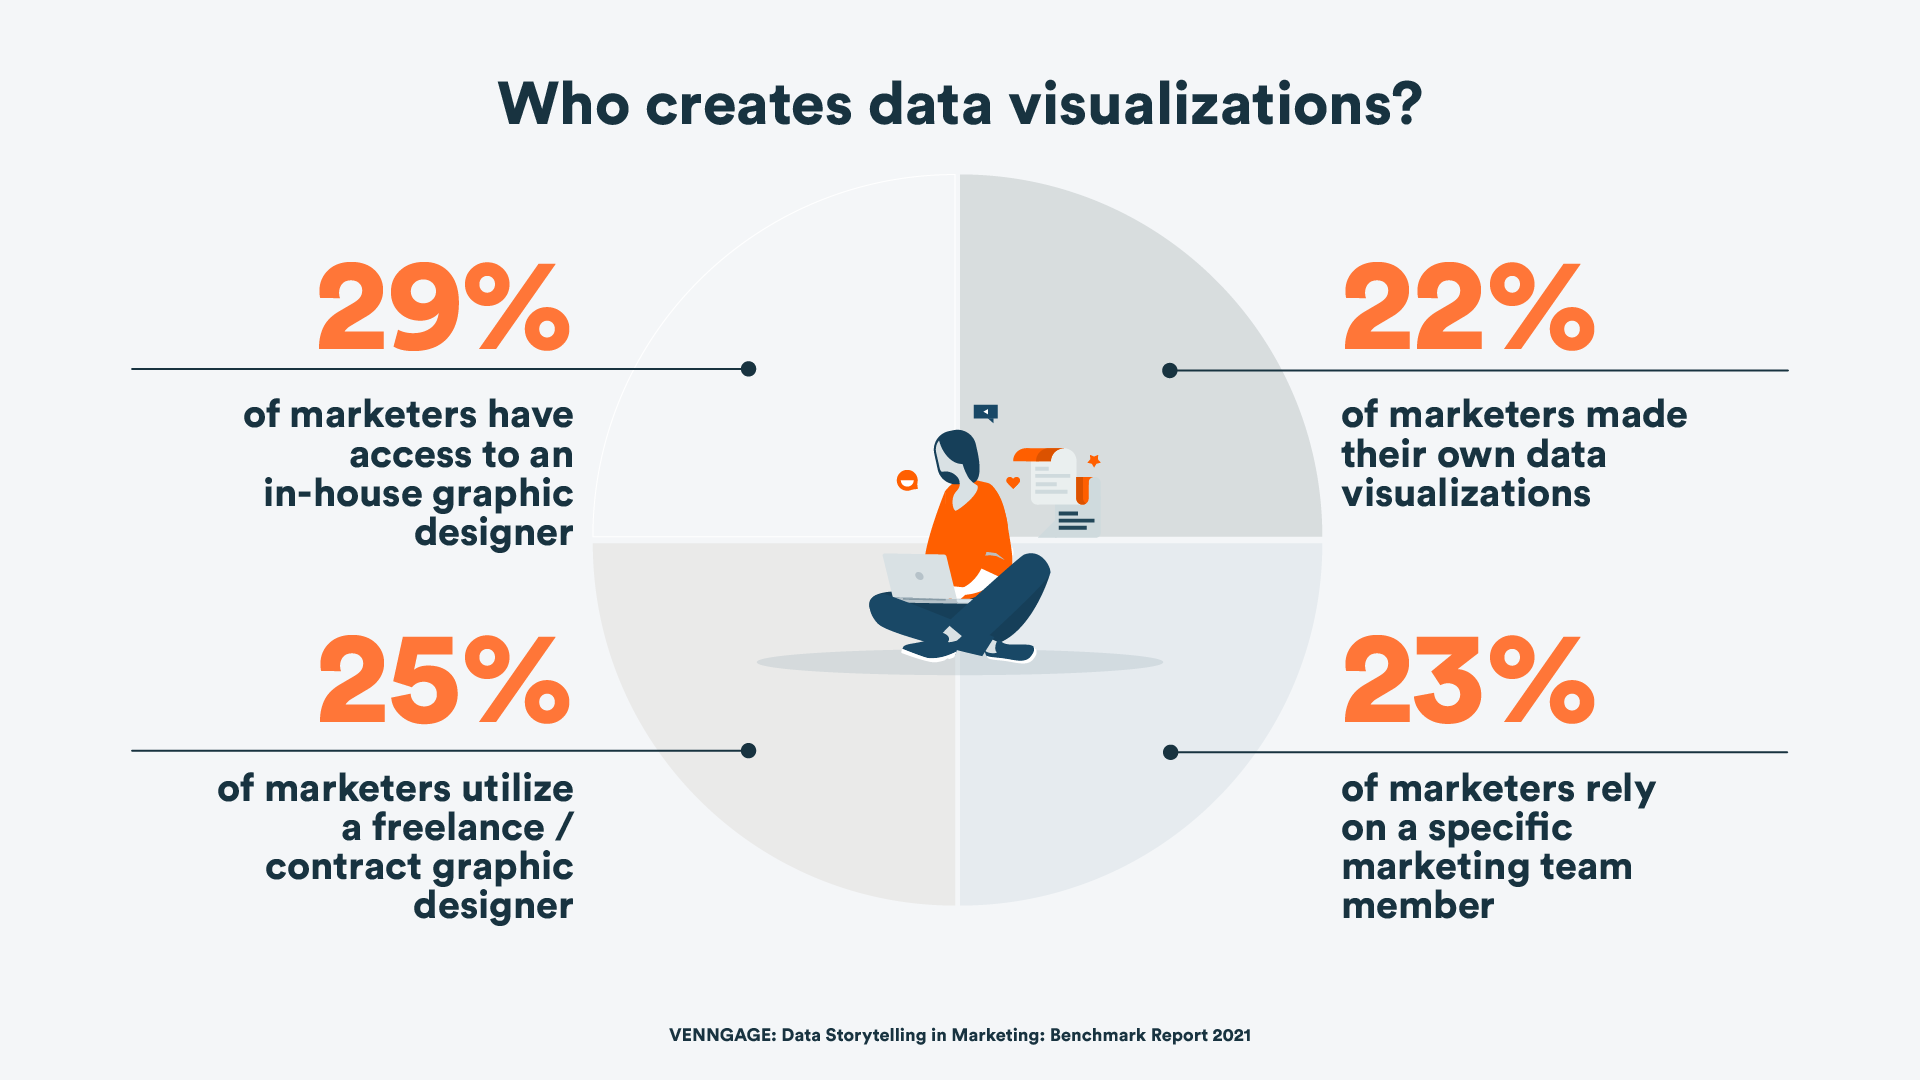
According to VENNGAGE, at least a quarter to a half of marketers are creating data visualizations themselves.
Here are some tips to help craft it:
- Always assume that your audience has limited knowledge of Advocacy. It might seem repetitive, but explain what your numbers represent, and the concepts behind them mean.
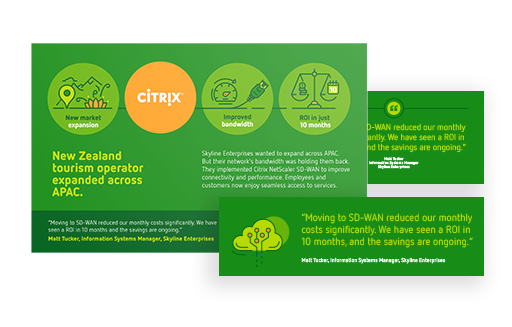
- Remember examples. Everything revolves around the customers. Make your report more relatable by providing examples of customers you engaged, quotes they said, deals they signed.
- Offer context. You onboarded 20 Advocates. Is that good or bad? How is it impacting the business? This is where you would go deeper into your dashboards and build the context that shows why your metric is important and why people should pay attention to it.
- Provide an action plan. Whether you had a good month or a slow one, look at the data to check if a significant improvement can be replicated or to determine how to tackle challenges.
- Create a template for your reporting and consider using two or three variations tailored to specific audiences. While your sales teams might not be interested in the engagement rates, your marketing colleagues will definitely want to know where your efforts are going. All variations can be put in one place, so your audience can choose how in-depth they want to go.
- Use your reports to spotlight your biggest collaborators and centralize all requests in one place. Create traction within your company by making it clear how people can contribute and how their efforts pan out. Celebrate the ones that are active and encourage others to join in the fun.
Once you have a solid approach to your storytelling and audience requirements, you can think of how you want to do it. We’d recommend using tools or software designed for reporting, such as Looker Studio or Power BI. Tools like these enable you to automate data gathering and visualization based on visual templates as well as data aggregation rules. You can even take advantage of automation to deliver your perfectly crafted and audience-tailored report to your stakeholders inbox at a specific time. However, using something simpler, like a spreadsheet or a presentation, is still a great way to tell the story behind the numbers in your Customer Advocacy Program.
At the end of the day, if you want to grow your program and make it stronger, showing its impact is as important as the work done behind closed doors. And how better to do that than by applying your storytelling skills to your reporting, so the audience can get a glimpse into your world?
Join the conversation on LinkedIn.