Advocacy Programs are often underestimated in their complexity. However, with the right reporting strategy, you can easily show the value of your Advocacy Program to your team and stakeholders. In this article, Iulia shares a step-by-step guide on how to build a comprehensive reporting base, from creating a list of data points to refining and improving your reporting structure. Say goodbye to time-sucking methods and unreliable reporting, and get ready to take your Advocacy Program to the next level.
An Advocacy Program is often more complex than it seems from the outside. People generally think that you secure advocates for activities to help sales and marketing and you build stories with customers, but that’s about the gist of it.
This can lead to a lot of confusion regarding the impact of your program. Other teams expect a fast turnaround and stories published every day, but they are not aware of the efforts you put in to make those numbers happen. Not unless you do not show them in a clear and easy-to-understand manner.
However, without a comprehensive reporting strategy, showing impact can quickly turn into a time-sucking task. Relying on manual tracking methods can make your reporting unreliable, as human errors happen. Fret not, because we put together a few steps to start shaping your reporting ecosystem.
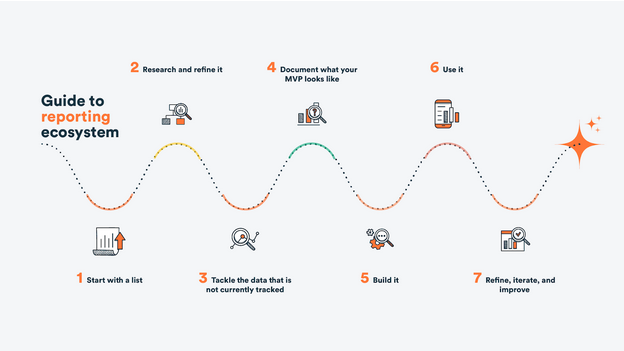
- It starts with a list
Build a list of data points you are already tracking and reporting on, then continue by adding the ones you would like to have. At this stage, you do not have to carefully curate the data points, but rather treat the exercise as a brainstorming session by adding everything you could think of that might show the value of your program.
- Research and refine your list
Now is the time to refine your list. For each of the data points, add the following information: what does it represent, why is it important, if it’s already tracked and where, who owns the tracking, and how often it is updated.
- Tackle the data that is not currently tracked
For data points which are not already tracked by you or other teams, start researching what would be needed to make it happen. If there are many, it is worth prioritizing them or checking if there are solutions that can provide multiple data points in a single go.
Tip: If you are unsure about the feasibility of some of your data points, ask for help from other teams in your company. Your data analysts and engineering teams might already have some of them on their radar or at least they can educate you in getting that specific data or the investment needed to track it.
- Document what your MVP looks like
Building your reporting structure is no easy feat. To avoid creating a confusing dashboard or something that will be hard to maintain, make sure to start by defining what is the minimum format that would work for you and how you want it to look like. Check if you or your data analyst can create a mock-up or just build on your already created list and play around with different visuals.
Tip: keep in mind that the audience for your dashboard is you and your team, so it can and should be as detailed as you need to quickly identify results, trends, and issues.
- Build it
This is where you or the team you are collaborating with starts building the MVP. Depending on complexity and data availability, this can be a lengthy process or one that can be tackled in a couple of weeks. Regardless, you are creating an instrument that will show your program’s pulse and help you scale.
- Use it
With your dashboard built, you can now start defining your reporting structure. We have prepared a guide on how to tell the story behind your numbers here.
- Refine, iterate, and improve
Although your reporting base will most likely be constant, your needs grow and change along with your program. You will add new advocacy tactics to your program or your stakeholders will want new data points. To keep up, schedule iterations into your calendar to ensure your dashboard is constantly reviewed and doesn’t get cluttered with legacy data.
While reporting may not be the most glamorous part of your job, tracking every detail will help you build a stronger and more scalable program. This, in turn, will help you take quick action to remedy common problems, analyze trends, and better plan for the future.
Join the conversation on LinkedIn.